
British Pound: GBP/USD (GBP=X) Support At 1.2650 – Live Trading News
British Pound News
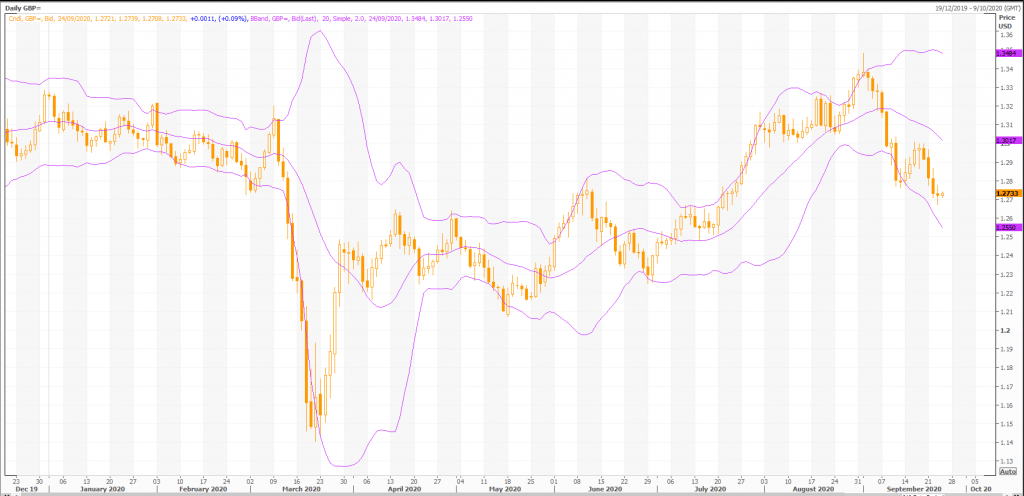
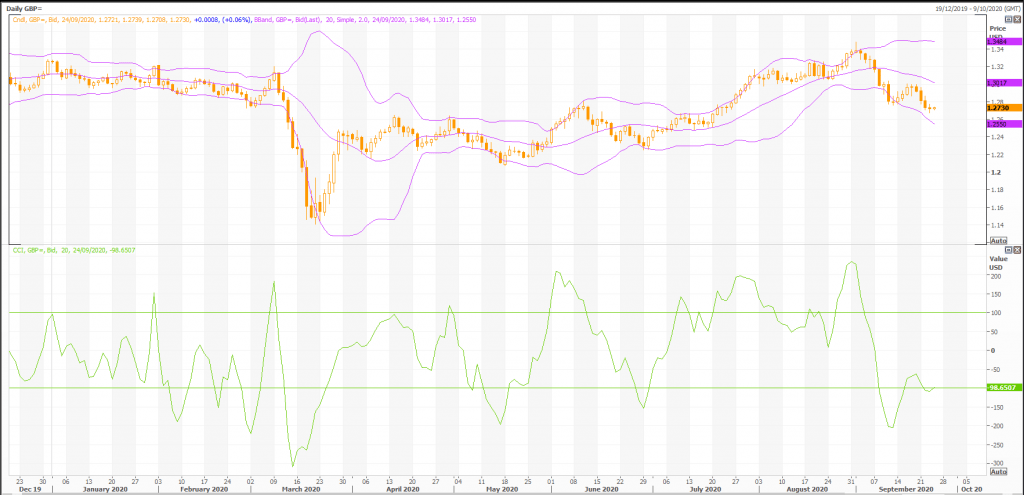
Yesterday, the GBP/USD exchange rate broke the lower boundary of the medium-term descending channel.
It is likely that the currency pair could gain support from the weekly S2, the monthly S3 and the Fibo 61.80% in the 1.2700 area. Thus, the pair could resume to trade within the given pattern.
In the meantime, note that the exchange rate could face the resistance area formed by the 55-, 100– and 200-hour SMAs, as well the weekly S1 and the monthly S2 in the 1.2797/1.2867 range.
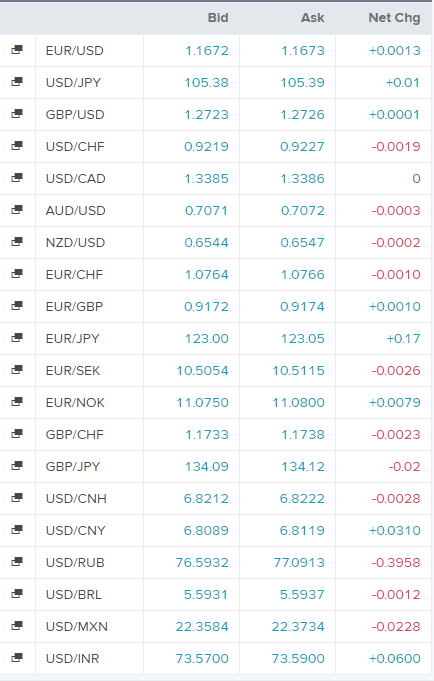
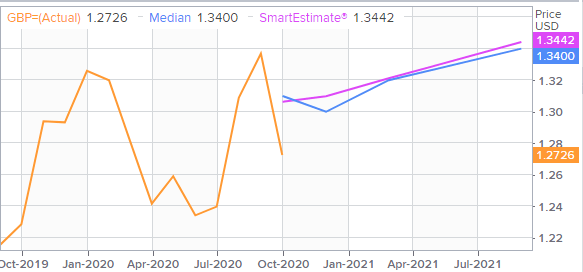
GBP/US Dollar Exchange Rate
Today’s Forex Rates
GBP/US Dollar FX Polls
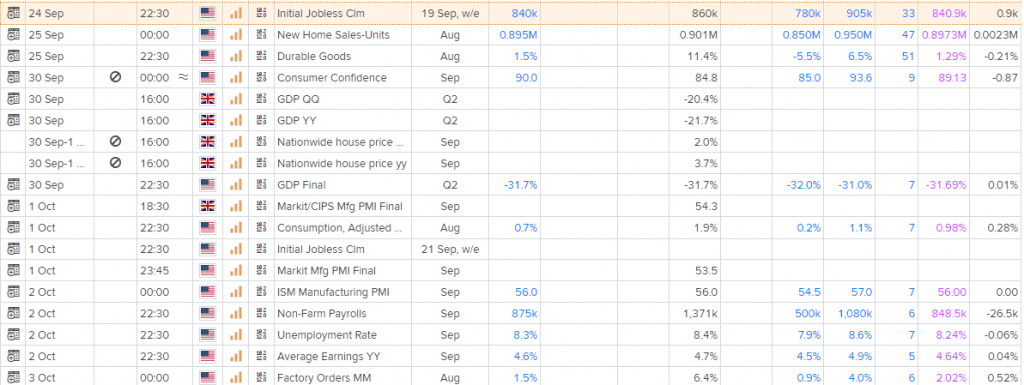
Economic Events
Technical Indicators
Overall, the bias in prices is: Downwards.
The projected upper bound is: 1.30.
The projected lower bound is: 1.25.
The projected closing price is: 1.27.
Candlesticks
A white body occurred (because prices closed higher than they opened).
During the past 10 bars, there have been 5 white candles and 5 black candles. During the past 50 bars, there have been 30 white candles and 20 black candles for a net of 10 white candles.
An engulfing bullish line occurred (where a white candle’s real body completely contains the previous black candle’s real body). The engulfing bullish pattern is bullish during a downtrend (which appears to be the case with FOREX GBP=). It then signifies that the momentum may be shifting from the bears to the bulls.
If the engulfing bullish pattern occurs during an uptrend, it may be a last engulfing top which indicates a top. The test to see if this is the case is if the next candle closes below the top of the current (white) candle’s real body.
A spinning top occurred (a spinning top is a candle with a small real body). Spinning tops identify a session in which there is little price action (as defined by the difference between the open and the close). During a rally or near new highs, a spinning top can be a sign that prices are losing momentum and the bulls may be in trouble.
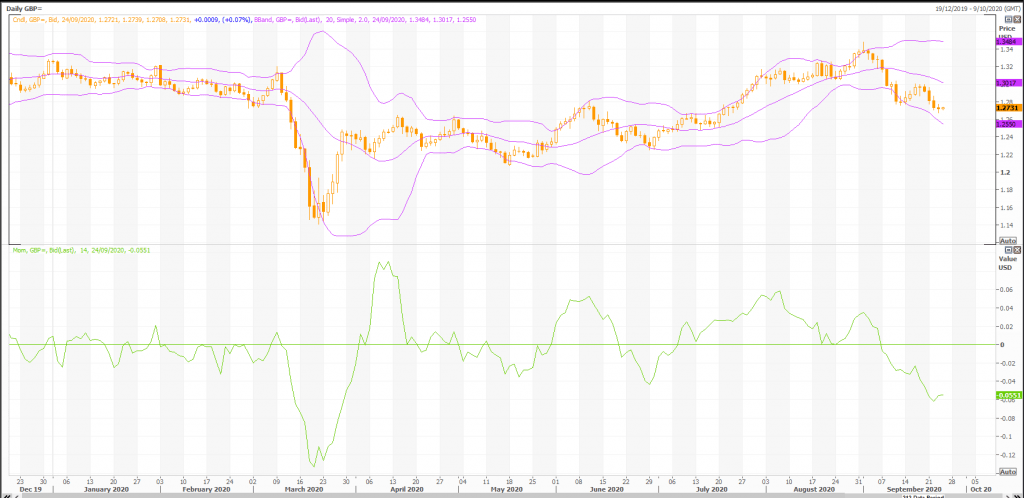
Momentum Indicators
Momentum is a general term used to describe the speed at which prices move over a given time period. Generally, changes in momentum tend to lead to changes in prices. This expert shows the current values of four popular momentum indicators.
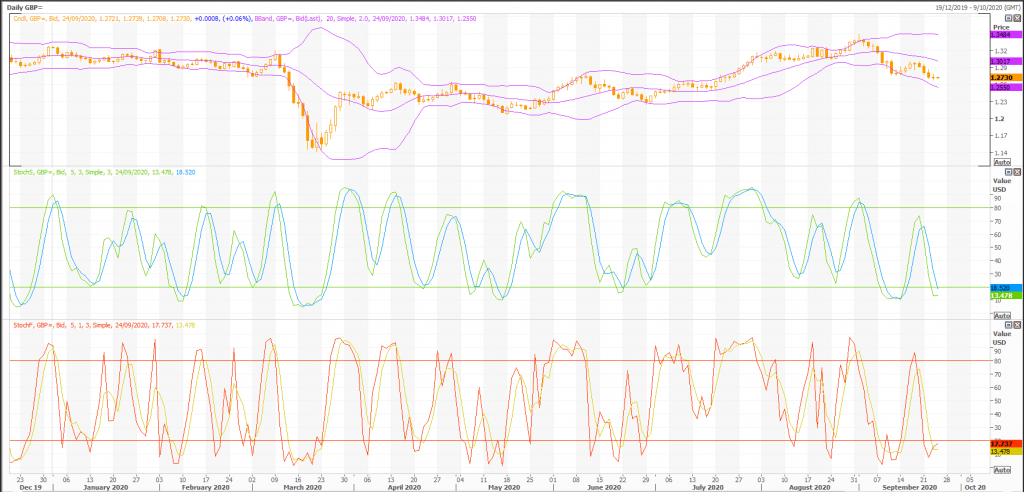
Stochastic Oscillator
One method of interpreting the Stochastic Oscillator is looking for overbought areas (above 80) and oversold areas (below 20). The Stochastic Oscillator is 14.1955. This is an oversold reading. However, a signal is not generated until the Oscillator crosses above 20 The last signal was a buy 6 period(s) ago.
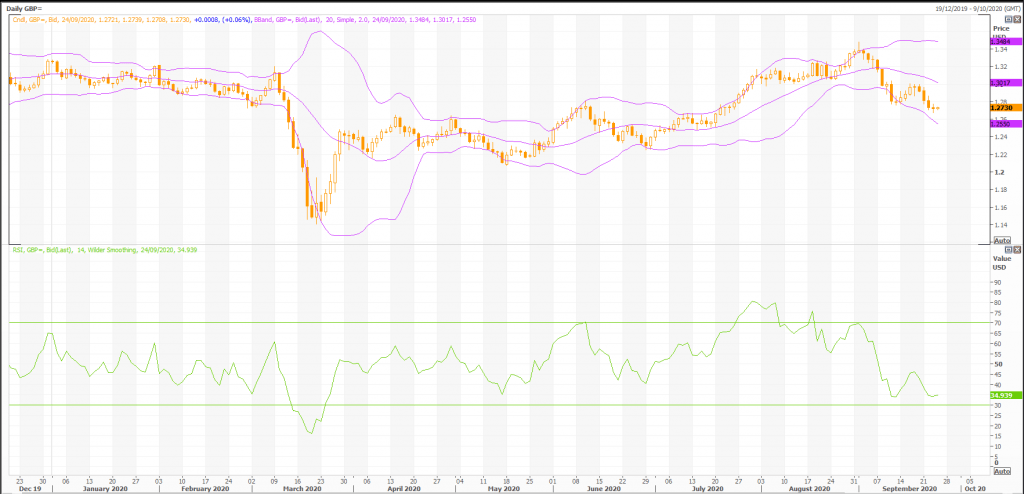
Relative Strength Index (RSI)
The RSI shows overbought (above 70) and oversold (below 30) areas. The current value of the RSI is 35.34. This is not a topping or bottoming area. A buy or sell signal is generated when the RSI moves out of an overbought/oversold area. The last signal was a sell 26 period(s) ago.
Commodity Channel Index (CCI)
The CCI shows overbought (above 100) and oversold (below -100) areas. The current value of the CCI is -114.This is an oversold reading. However, a signal isn’t generated until the indicator crosses above -100. The last signal was a buy 7 period(s) ago.
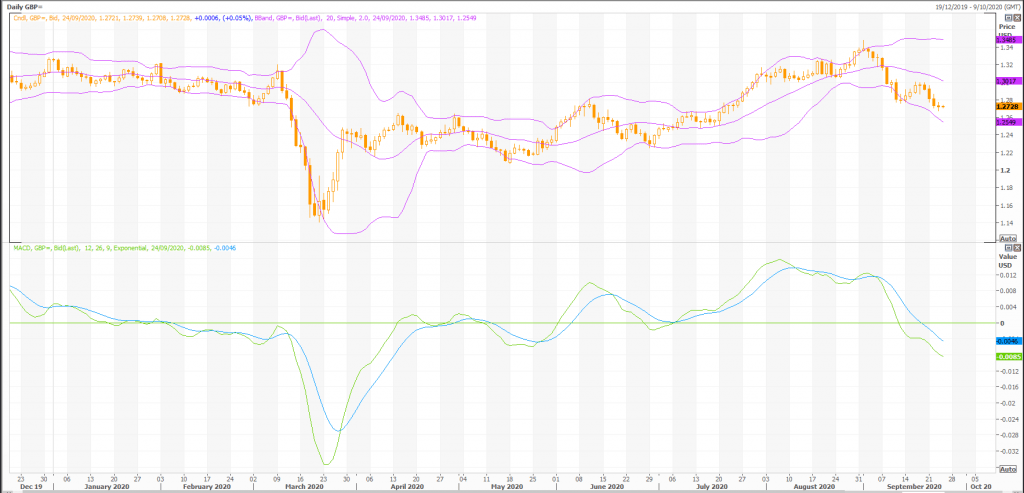
MACD
The Moving Average Convergence/Divergence indicator (MACD) gives signals when it crosses its 9 period signal line. The last signal was a sell 13 period(s) ago.
Rex Takasugi – TD Profile
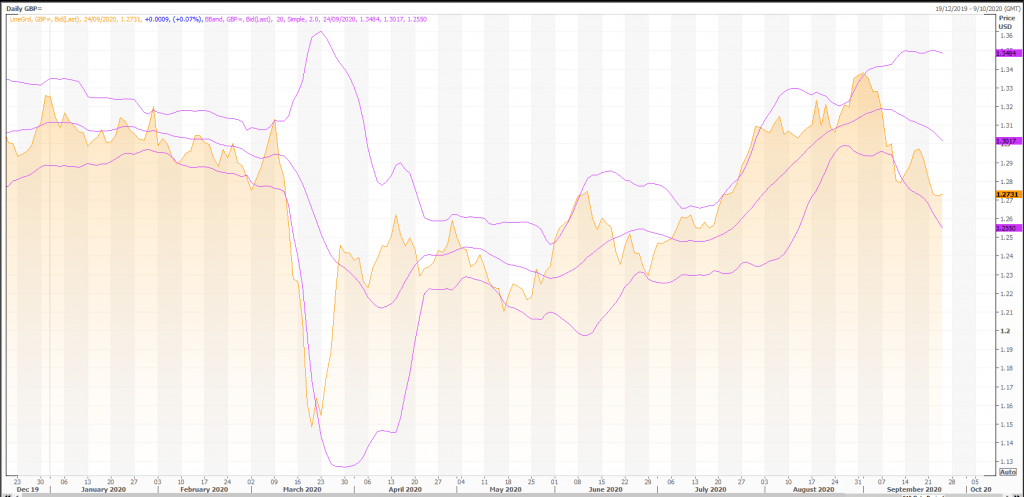
FOREX GBP= closed up 0.001 at 1.273. Volume was 81% below average (consolidating) and Bollinger Bands were 67% wider than normal.
Open High Low Close Volume 1.272 1.274 1.271 1.273 23,766 Technical Outlook Short Term: Oversold Intermediate Term: Bearish Long Term: Bullish Moving Averages: 10-period 50-period 200-period Close: 1.28 1.30 1.27 Volatility: 8 11 14 Volume: 128,990 121,993 122,314
Short-term traders should pay closer attention to buy/sell arrows while intermediate/long-term traders should place greater emphasis on the Bullish or Bearish trend reflected in the lower ribbon.
Summary
FOREX GBP= is currently 0.1% above its 200-period moving average and is in an downward trend. Volatility is high as compared to the average volatility over the last 10 periods.
Our volume indicators reflect moderate flows of volume out of GBP= (mildly bearish). Our trend forecasting oscillators are currently bearish on GBP= and have had this outlook for the last 11 periods.