
Euro: EUR/USD (EUR=X) Are You an Average Trader? – Live Trading News
Euro Outlook
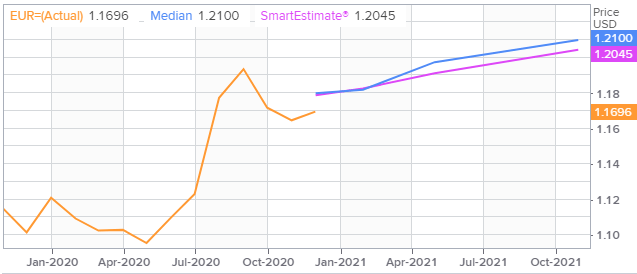
Euro/US Dollar Exchange Rate
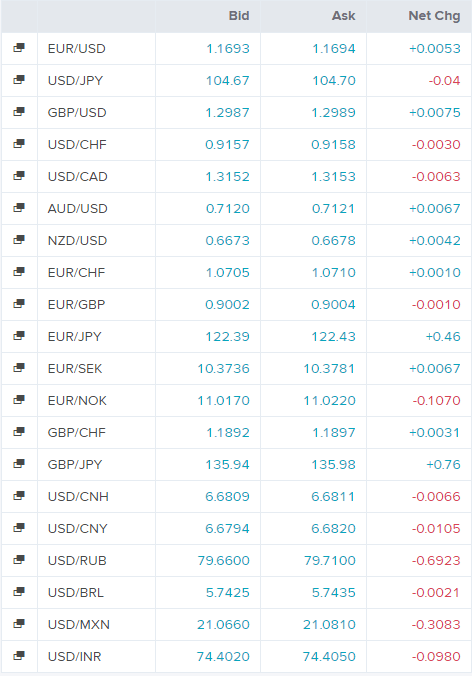
Today’s Forex Rates
EUR/USD FX Polls
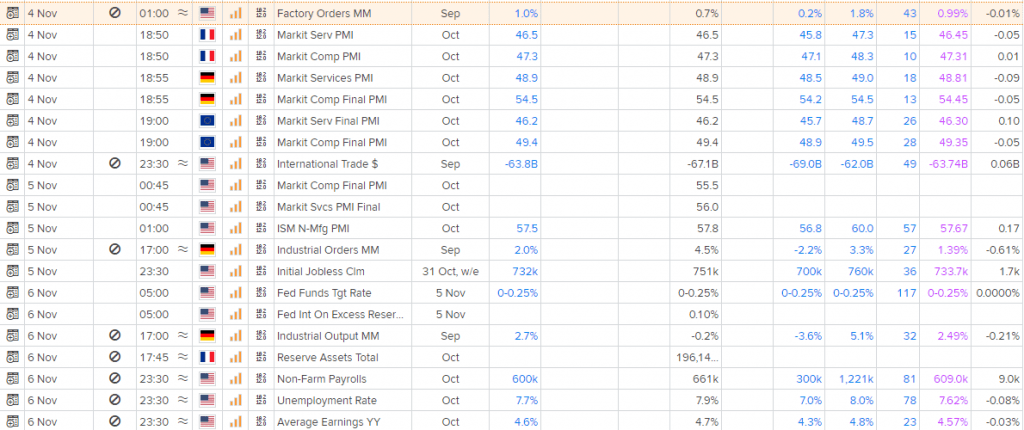
Economic Events
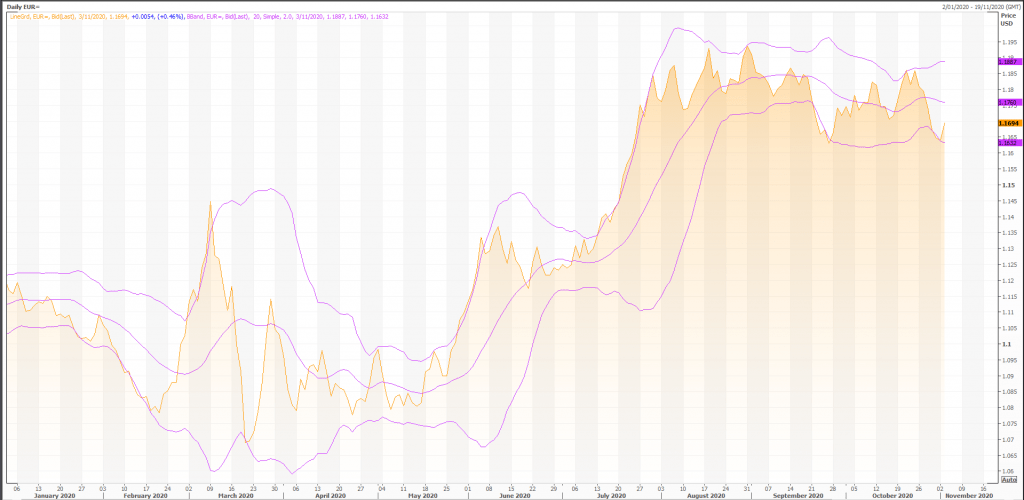
Technical Indicators
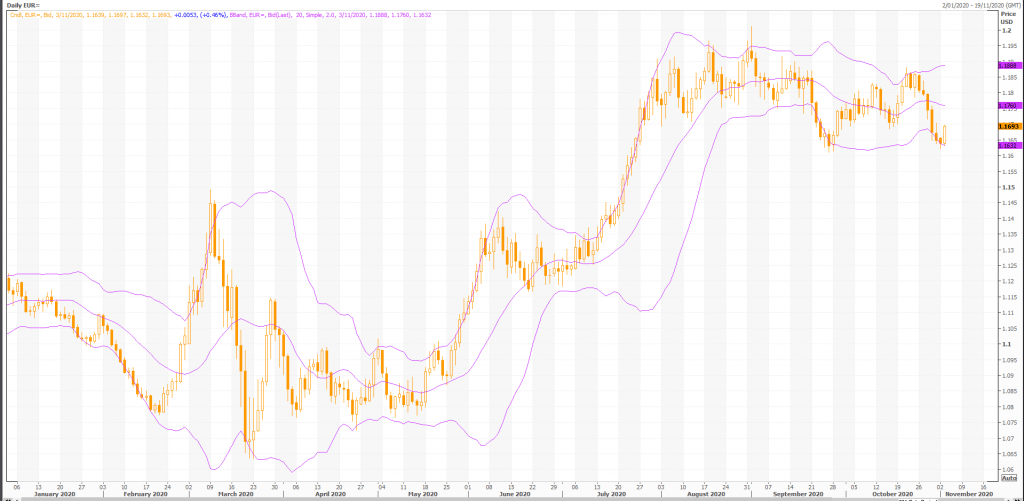
Overall, the bias in prices is: Sideways.
By the way, prices are vulnerable to a correction towards 1.16.
The projected upper bound is: 1.18.
The projected lower bound is: 1.16.
The projected closing price is: 1.17.
Candlesticks
A white body occurred (because prices closed higher than they opened).
During the past 10 bars, there have been 3 white candles and 7 black candles for a net of 4 black candles. During the past 50 bars, there have been 21 white candles and 29 black candles for a net of 8 black candles.
An engulfing bullish line occurred (where a white candle’s real body completely contains the previous black candle’s real body). The engulfing bullish pattern is bullish during a downtrend (which appears to be the case with FOREX EUR=). It then signifies that the momentum may be shifting from the bears to the bulls.
If the engulfing bullish pattern occurs during an uptrend, it may be a last engulfing top which indicates a top. The test to see if this is the case is if the next candle closes below the top of the current (white) candle’s real body.
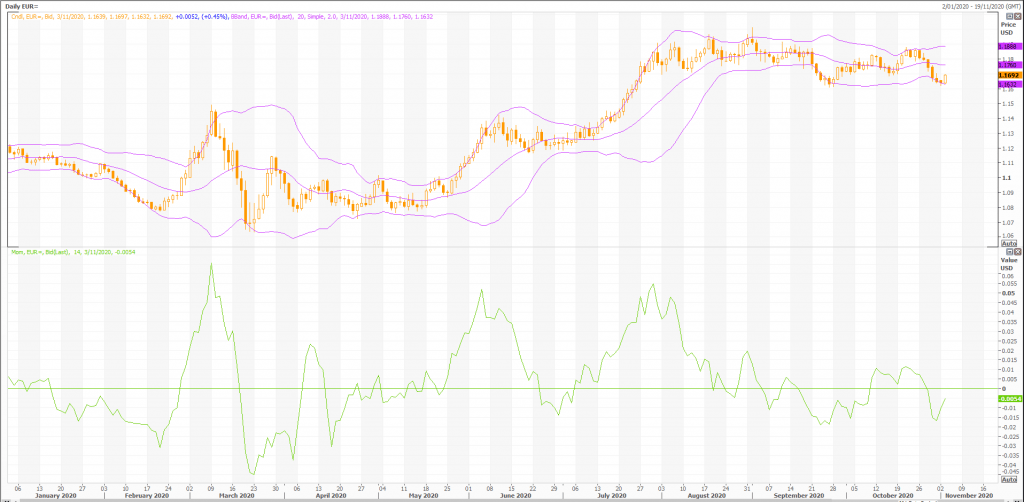
Momentum Indicators
Momentum is a general term used to describe the speed at which prices move over a given time period. Generally, changes in momentum tend to lead to changes in prices. This expert shows the current values of four popular momentum indicators.
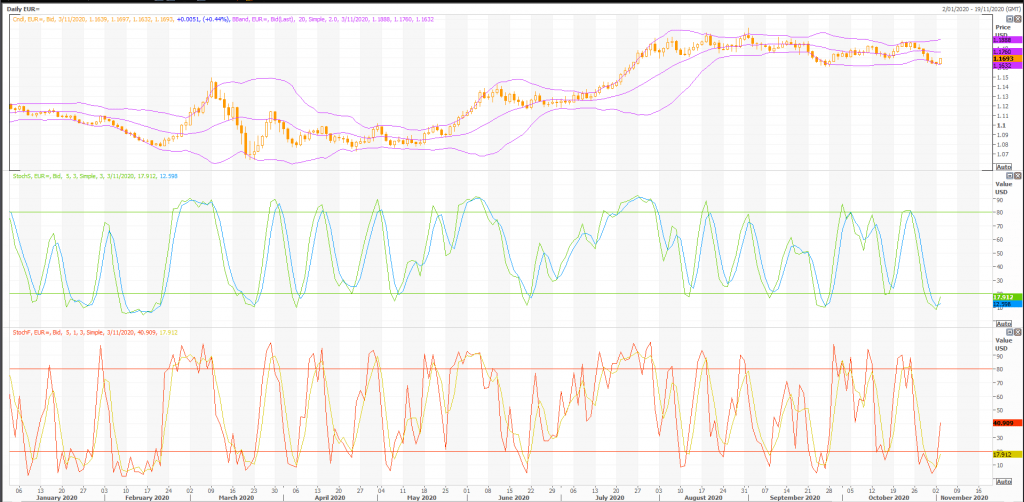
Stochastic Oscillator
One method of interpreting the Stochastic Oscillator is looking for overbought areas (above 80) and oversold areas (below 20). The Stochastic Oscillator is 16.2868. This is an oversold reading. However, a signal is not generated until the Oscillator crosses above 20 The last signal was a sell 6 period(s) ago.
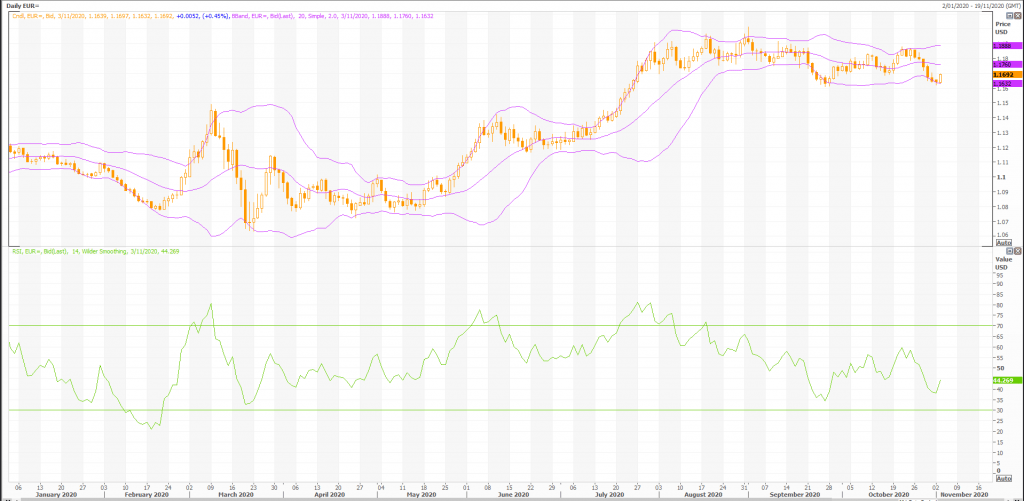
Relative Strength Index (RSI)
The RSI shows overbought (above 70) and oversold (below 30) areas. The current value of the RSI is 44.37. This is not a topping or bottoming area. A buy or sell signal is generated when the RSI moves out of an overbought/oversold area. The last signal was a sell 54 period(s) ago.
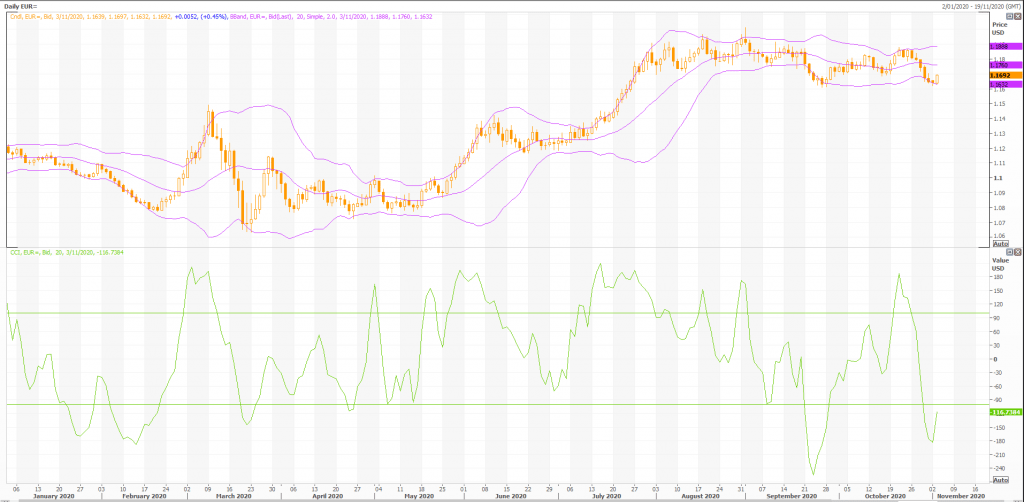
Commodity Channel Index (CCI)
The CCI shows overbought (above 100) and oversold (below -100) areas. The current value of the CCI is -88. This is not a topping or bottoming area. The last signal was a buy 0 period(s) ago.
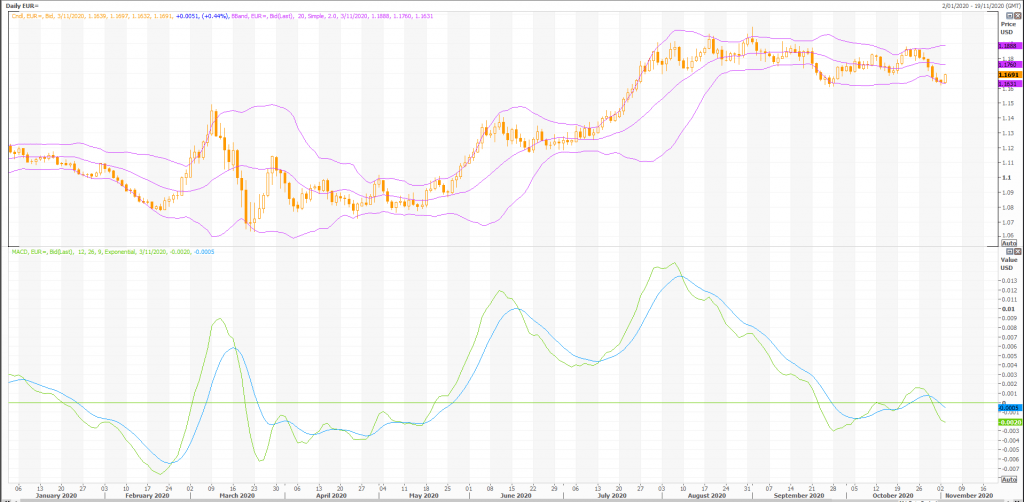
MACD
The Moving Average Convergence/Divergence indicator (MACD) gives signals when it crosses its 9 period signal line. The last signal was a sell 3 period(s) ago.
Rex Takasugi – TD Profile
FOREX EUR= closed up 0.005 at 1.169. Volume was 64% below average (consolidating) and Bollinger Bands were 16% narrower than normal.
Open High Low Close Volume 1.164 1.170 1.163 1.169 36,971 Technical Outlook Short Term: Oversold Intermediate Term: Bearish Long Term: Bullish Moving Averages: 10-period 50-period 200-period Close: 1.18 1.18 1.13 Volatility: 7 7 10 Volume: 96,597 100,753 106,550
Short-term traders should pay closer attention to buy/sell arrows while intermediate/long-term traders should place greater emphasis on the Bullish or Bearish trend reflected in the lower ribbon.
Summary
FOREX EUR= is currently 3.3% above its 200-period moving average and is in an downward trend. Volatility is relatively normal as compared to the average volatility over the last 10 periods.
Our volume indicators reflect volume flowing into and out of EUR= at a relatively equal pace (neutral). Our trend forecasting oscillators are currently bearish on EUR= and have had this outlook for the last 1 periods.